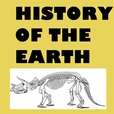
Summary: Welcome to the History of the Earth, which has now evolved into a general podcast covering all things geological. I’m your host, geologist Dick Gibson. Today I’m going to talk a bit about one of my specialties, interpretation of gravity data. Specifically, gravity data derived from a satellite. Measurements of the earth’s gravity field are essentially measurements of the attraction of the earth on a spring – the more the spring extends, the stronger the pull of gravity, and the stronger pull of gravity occurs where denser materials are present beneath that spring. We can actually measure those attractions with such precision that we can identify areas where there are varying distributions of rocks of different density – or more correctly, we can identify locations of density contrast, where there is a change from one density to another. A classic example is a salt dome. Salt, the mineral halite, has a density of around 2.15 grams per cubic centimeter, while common rocks like shale and sandstone have densities of anywhere from 2.4 to 2.6 grams per cubic centimeter, within an even larger range. So when a low-density, buoyant salt dome rises up through shales and sandstones, it creates a pretty significant density contrast, and a salt dome often produces a strikingly intense, circular gravity low, representing the low-density salt versus the surrounding denser rocks. Satellite gravity map of western India, from Technical University of Delft. The gravity low discussed in the podcast is circled.Since the 1920s we’ve had gravity meters that can measure the earth’s gravity field, and maps of the distribution of gravity data have guided oil exploration as well as our understanding of regional geology and tectonics ever since. Most of those gravity data were acquired by people driving or hiking across country, sitting a gravity meter down, and making a measurement. Time intensive and expensive. Eventually we developed technologies to allow the gravity field to be measured from a moving aircraft or from a moving boat – such measurements are lower quality, but they’re a lot cheaper. In the middle 1990s incredibly accurate radar altimeters were developed and deployed on satellites. A radar altimeter is basically a range-finder, an extremely accurate tool for measuring distance. The radar signal goes out and bounces back, and the time it takes for the trip is proportional to the distance the radar beam traveled. So you can visualize a sensitive radar altimeter on a satellite as something that can give incredibly accurate measurements of the height of the land – topography. The satellite-borne radar altimeters had centimeter-scale accuracy. But it can do more. Over the oceans, the radar altimeter measures the distance from the satellite to the surface of the ocean. That’s cool, but so what? Ocean surfaces are really very irregular, with waves, currents, and so on to make any measurements at the level of centimeters irrelevant, right? Right. But if you make the measurements dozens, hundreds, thousands of times, you effectively average out things like waves and currents. You get an average measurement of the height of the surface of the ocean. OK, really it’s the distance from the satellite – whose elevation is precisely known – to the ocean surface, but it’s OK to think of that as the sea’s height. Again, so what? Well, the average height of the sea surface on a perfectly uniform sphere, the earth, would be a uniform surface, and it actually has a name, the geoid. But the earth is anything but uniform. And in fact we can use the satellite radar altimeter measurements to make maps that are essentially representations of the attraction of gravity – and the accuracy is high enough that we can actually see geological features. Imagine the sharp slope on the sub-sea edge of a continent – the position where the water gets abruptly deeper. This happens around all the continents. The dramatic contrast in density between water and any rock, any rock